1. Choose the monitor to report for.
2. Define the start date and the end of the report.
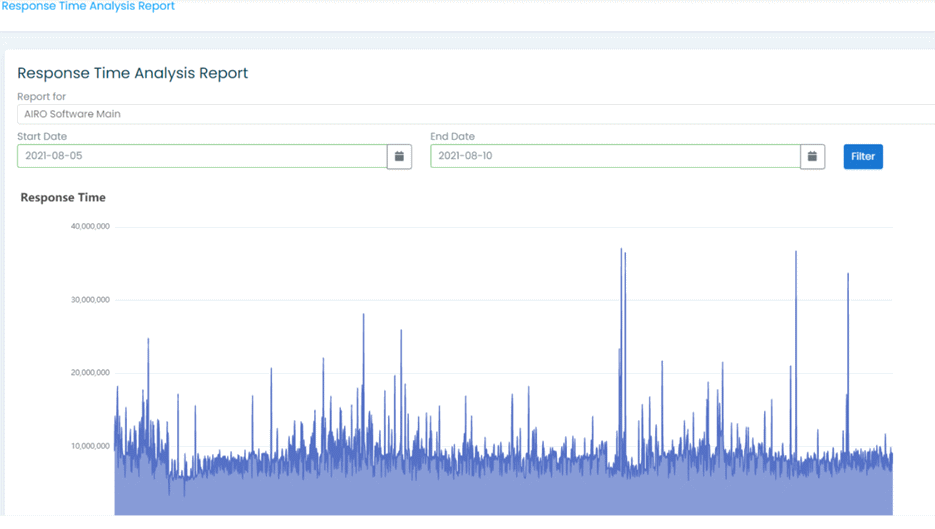
3. After entering all the details press the button ‘Filter’ and the graph, as seen above, should be shown clearly indicating the response time of the website in the time range given in the filter.
You can choose to download the graph by clicking this icon:

Adjust the slider underneath the graph to zoom in the graph or alternatively, you can use the zoom button:
