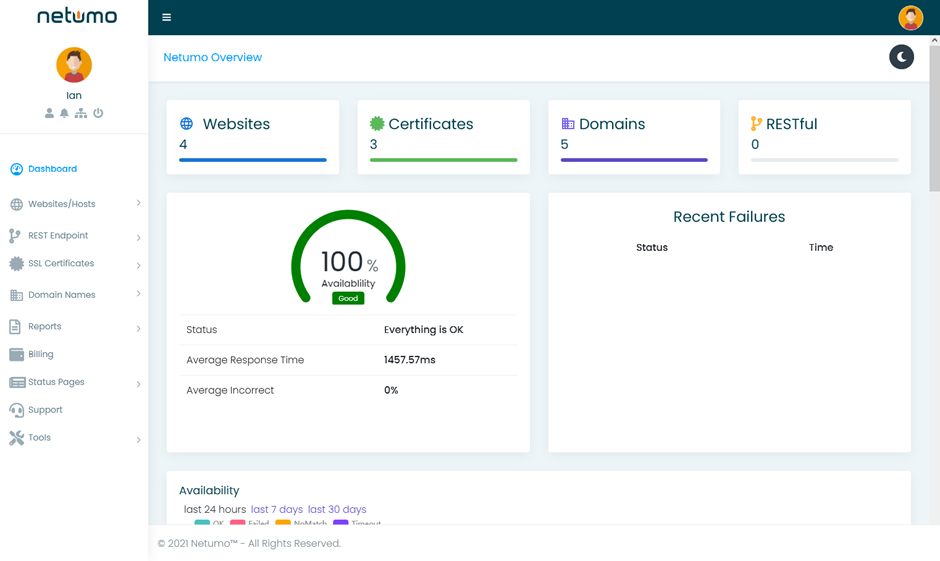
The Netumo Dashboard serves as an overview of the status of your whole monitors. It consists of the following:
- A record of how many websites, certificates, domains, and RESTful APIs you have.
- Availability of all websites monitored given as a percentage, status, average response time, and average incorrectness in all websites being monitored.
- Any recent failures are listed.

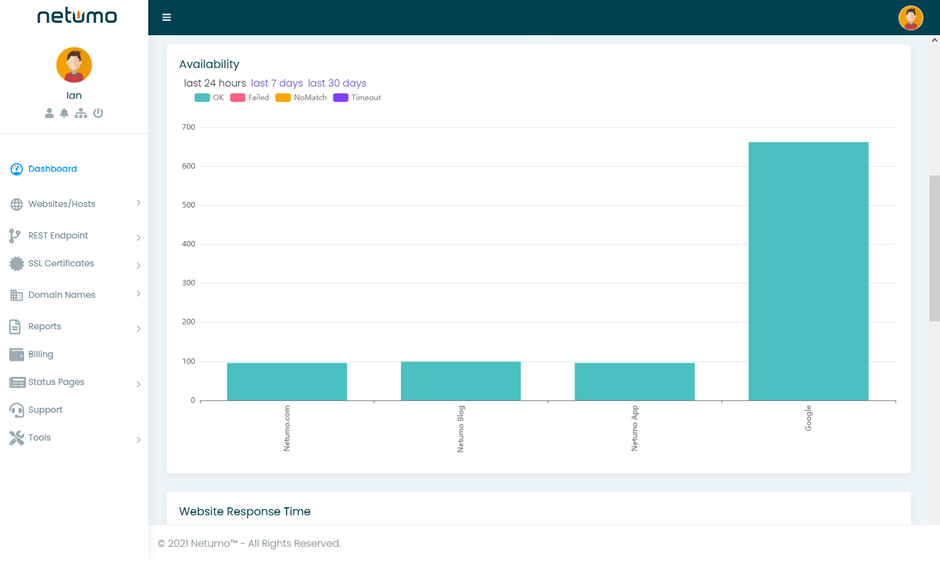
- Availability of all monitors in the last 24 hours, 7 days, or 30 days represented in bar charts.

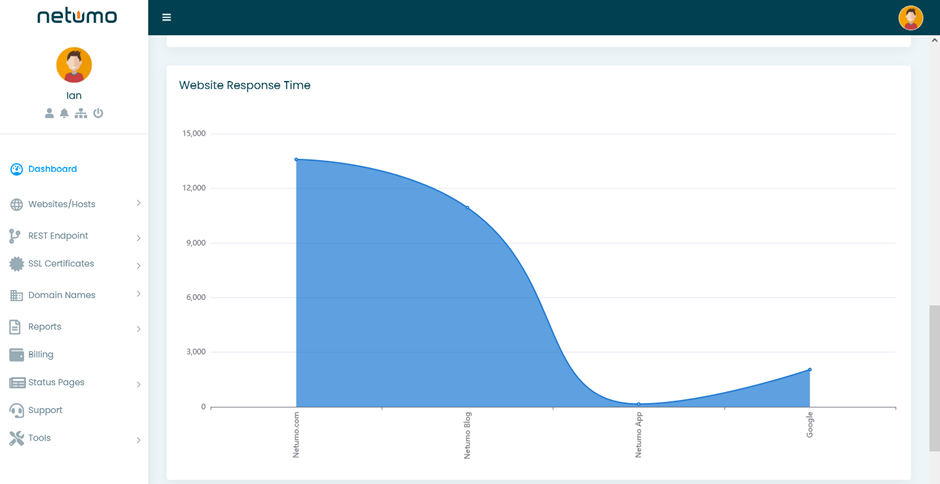
- Website/RESTful monitors response time of all monitors is given as a graph.

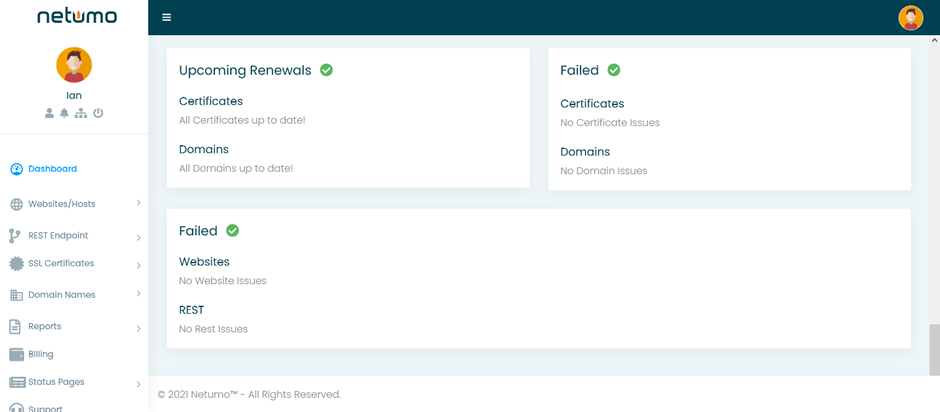
- Any upcoming renewals or failures of certificates and domains are given.
- Any failures for Websites or RESTful APIs are also given.
